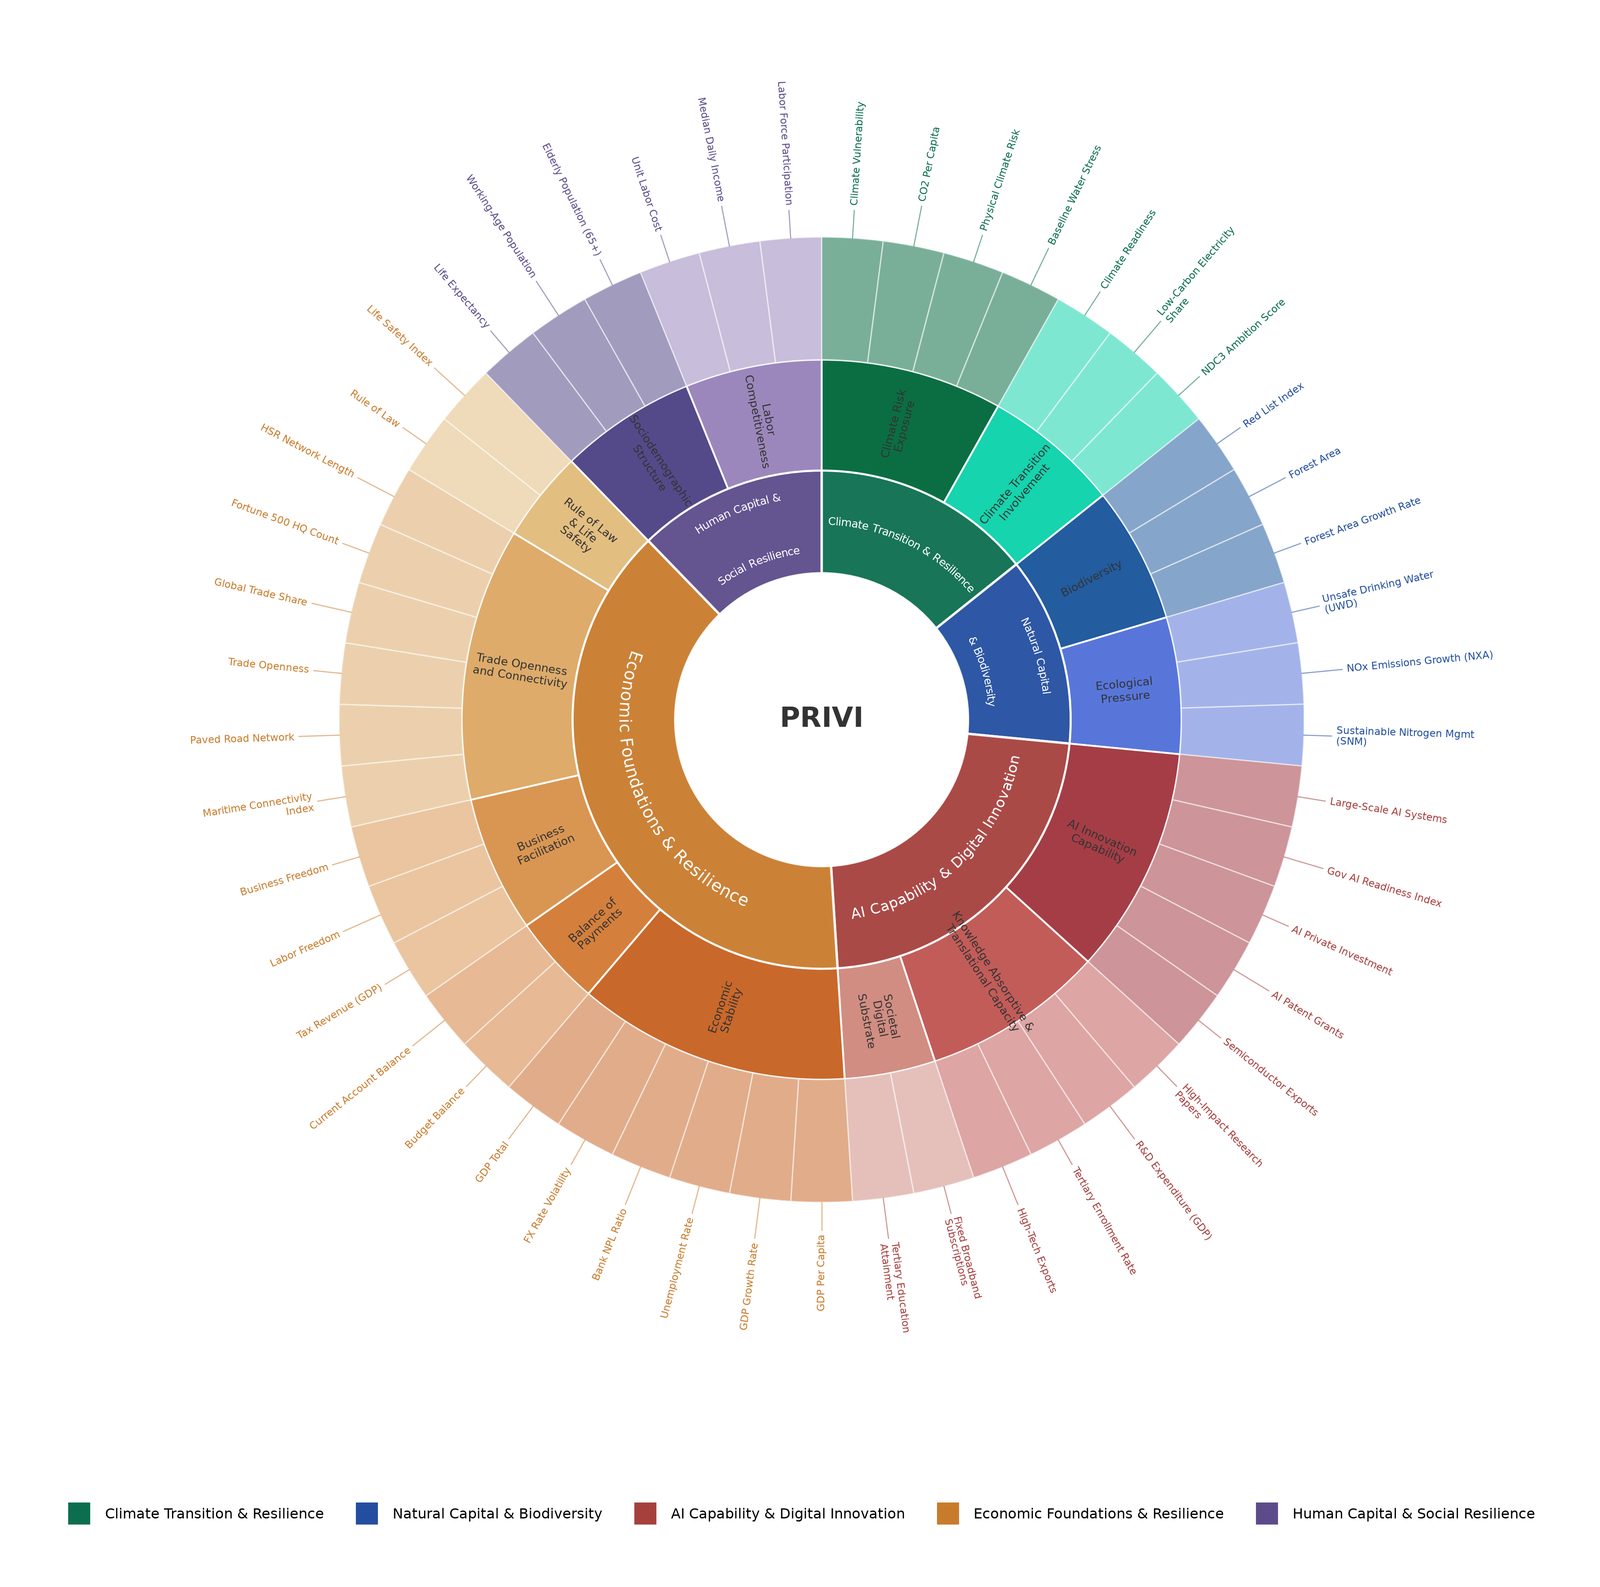
Figure 1 · The PRIVI System
The full PRIVI indicator system
5 Dimensions · 14 Sub-dimensions · 49 Indicators
What Each Dimension Means
Five categories of long-term value capital
Climate Transition & Resilience
Evaluates physical climate risk exposure and climate transition involvement — whether an economy has the capability foundation to address climate change and support long-term value creation.
Natural Capital & Biodiversity
Brings biodiversity protection and ecological pressure into the quantitative framework — the natural-capital foundation that sustains long-term growth.
AI Capability & Digital Innovation
Measures AI R&D, knowledge translation, and digital foundations — the capacity to compete in the next round of industrial competition and drive long-term productivity growth.
Economic Foundations & Resilience
A comprehensive measure of capital-formation capacity and institutional safeguards — whether the other four capitals can be turned into actual long-term returns.
Human Capital & Social Resilience
Measures a healthy demographic structure, a quality labor force, and sustainable social income conditions.
Data Sources
24 international data sources
International organisations, think tanks & academic institutions
| # | Data Source | Institution Type | Update Frequency |
|---|---|---|---|
| 01 | World Bank World Development Indicators (WDI) | International Organization | Annual |
| 02 | Our World in Data | Non-profit Research Platform | Annual |
| 03 | Notre Dame Global Adaptation Initiative (ND-GAIN) | University Think Tank | Annual |
| 04 | Yale Environmental Performance Index (EPI 2024) | Academic Research Institution | Biennial |
| 05 | Stanford AI Index (Stanford HAI) | University Think Tank | Annual |
| 06 | IMF World Economic Outlook (WEO) | International Organization | Semi-annual |
| 07 | UN FAO FAOSTAT Land Use | International Organization | Annual |
| 08 | Heritage Foundation Economic Freedom Index | Think Tank | Annual |
| 09 | International Labour Organization (ILO) | International Organization | Annual |
| 10 | WRI Aqueduct Water Risk Atlas | Think Tank | Irregular |
| 11 | Climate Action Tracker (CAT) | Non-profit Research Platform | ~5 years (per NDC cycle) |
| 12 | Oxford Insights Government AI Readiness Index | Think Tank | Annual |
| 13 | Nature Index | Academic Publishing Institution | Annual |
| 14 | IMF Financial Soundness Indicators (FSI) | International Organization | Quarterly |
| 15 | IMF International Financial Statistics (IFS) | International Organization | Monthly |
| 16 | UNCTAD Liner Shipping Connectivity Index (LSCI) | International Organization | Quarterly |
| 17 | International Road Federation (IRF) | International Organization | Annual |
| 18 | World Trade Organization (WTO) | International Organization | Annual |
| 19 | Fortune Global 500 | Commercial Media | Annual |
| 20 | International Union of Railways (UIC) | International Organization | Annual |
| 21 | World Bank Worldwide Governance Indicators (WGI) | International Organization | Annual |
| 22 | Center for International Development of Traditional Chinese Medicine, PRSLI | University Think Tank | Annual |
| 23 | UN Department of Economic and Social Affairs (UNDESA) | International Organization | Annual |
| 24 | UN Population Division | International Organization | Annual |
Economy Selection
Why these 43 economies
Global economic weight
The Pacific Rim concentrates over 60% of global GDP output and brings together the US, China, Japan, South Korea, Singapore, and other core innovation nodes of the global AI and digital economy.
Climate and ecological tension
One of the most concentrated zones for climate physical risk and natural-capital pressure — from sea-level rise in Pacific island economies to Ring of Fire disaster exposure.
A supply-chain restructuring test bed
Global supply-chain restructuring is profoundly reshaping the region's industrial landscape — a natural testing ground for how long-term investment value evolves.
Diverse development stages
Covers five blocs — East Asia, Southeast Asia, the Pacific islands, Latin America, and North America — spanning developed, emerging, and Pacific island developing economies.